Explore Materials in 3D
Representative Nano-CT reconstructions from research conducted at WSU.
Sheets of Magnetite Nanolites in Obsidian
Ce–La Glass-Ceramic Crystallization
Archaeological Egyptian Blue
Dendritic Powellite in Glass
Phase Separation in Ba–B–Si–O Glass
Six-Fold Dendrite Crystal
Phase Separation in Ag–As–S Glass
Six-Fold Dendrites Crystals
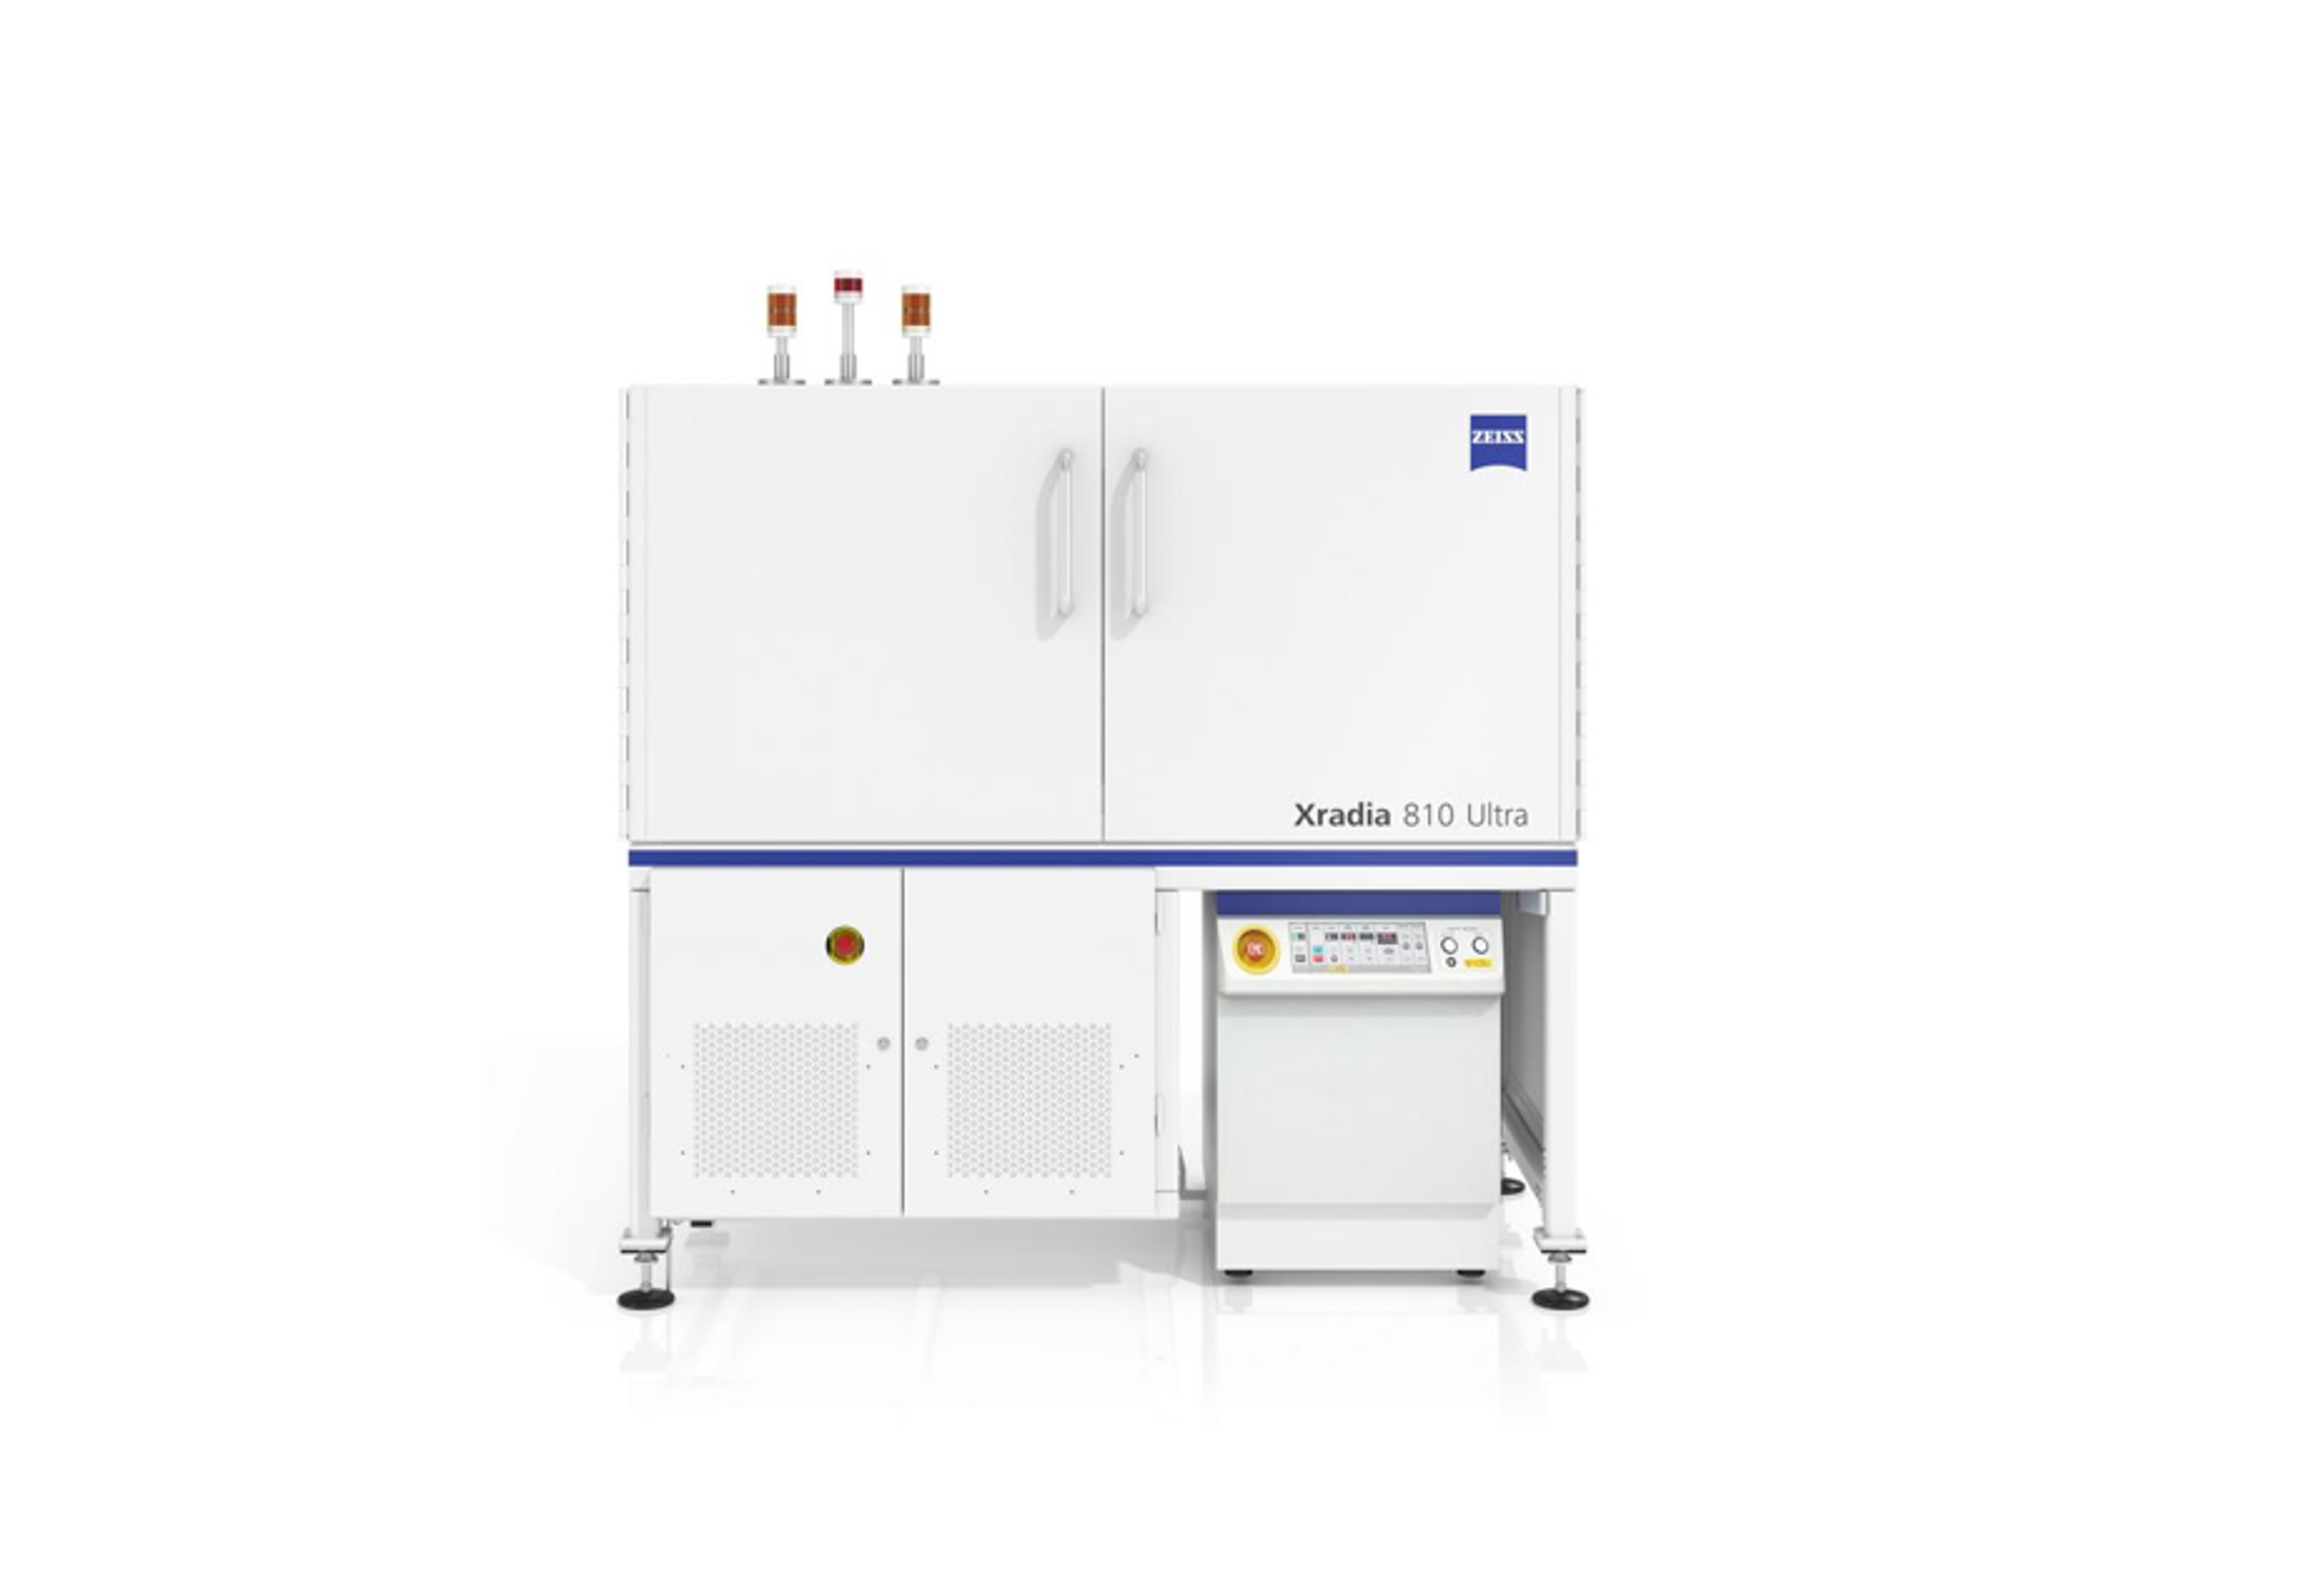
Zeiss Xradia 810 Ultra
The Zeiss Xradia 810 Ultra is a laboratory-based X-ray microscope for nondestructive three-dimensional imaging of internal microstructures. Using a chromium X-ray source, the system can achieve spatial resolution down to approximately 50 nm, enabling visualization of features such as crystallization, phase separation, porosity, interfaces, and internal defects.
Capbility
The Zeiss Xradia 810 Ultra is a nondestructive nanoscale X-ray microscope capable of high-resolution 2D and 3D imaging of internal microstructures. The instrument uses a chromium X-ray source and provides spatial resolution down to approximately 50 nm, enabling three-dimensional reconstruction and quantitative analysis of features that cannot be accessed by conventional optical microscopy or standard micro-CT.
Key capabilities include:
- Nondestructive 3D X-ray tomography
- Spatial resolution down to ~50 nm
- Visualization of internal pores, cracks, interfaces, particles, and microstructural features
- 3D reconstruction, virtual sectioning, and volumetric analysis
- Imaging of materials without physical sectioning or destructive sample preparation
- Suitable for battery materials, geological samples, porous materials, carbon fibers, catalyst substrates, fuel cells, and other heterogeneous materials
- Potential for in-situ/operando studies, including observation of battery structures during charge–discharge cycling
The instrument is available for WSU researchers as well as external academic, national laboratory, and industrial users through the IMR service center.
Nano-CT Applications
1. Glasses & Glass Ceramics
Phase separation, crystallization, dendritic growth, inclusions, and three-dimensional microstructure.
LaCaMo-X Imaging.
Bussey et al., Materials Letters 369 (2024) 136688.
Barium borosilicate glass (BaBSiO Critical Sol).
Bussey et al., J. Non-Cryst. Solids 600 (2023) 121987.
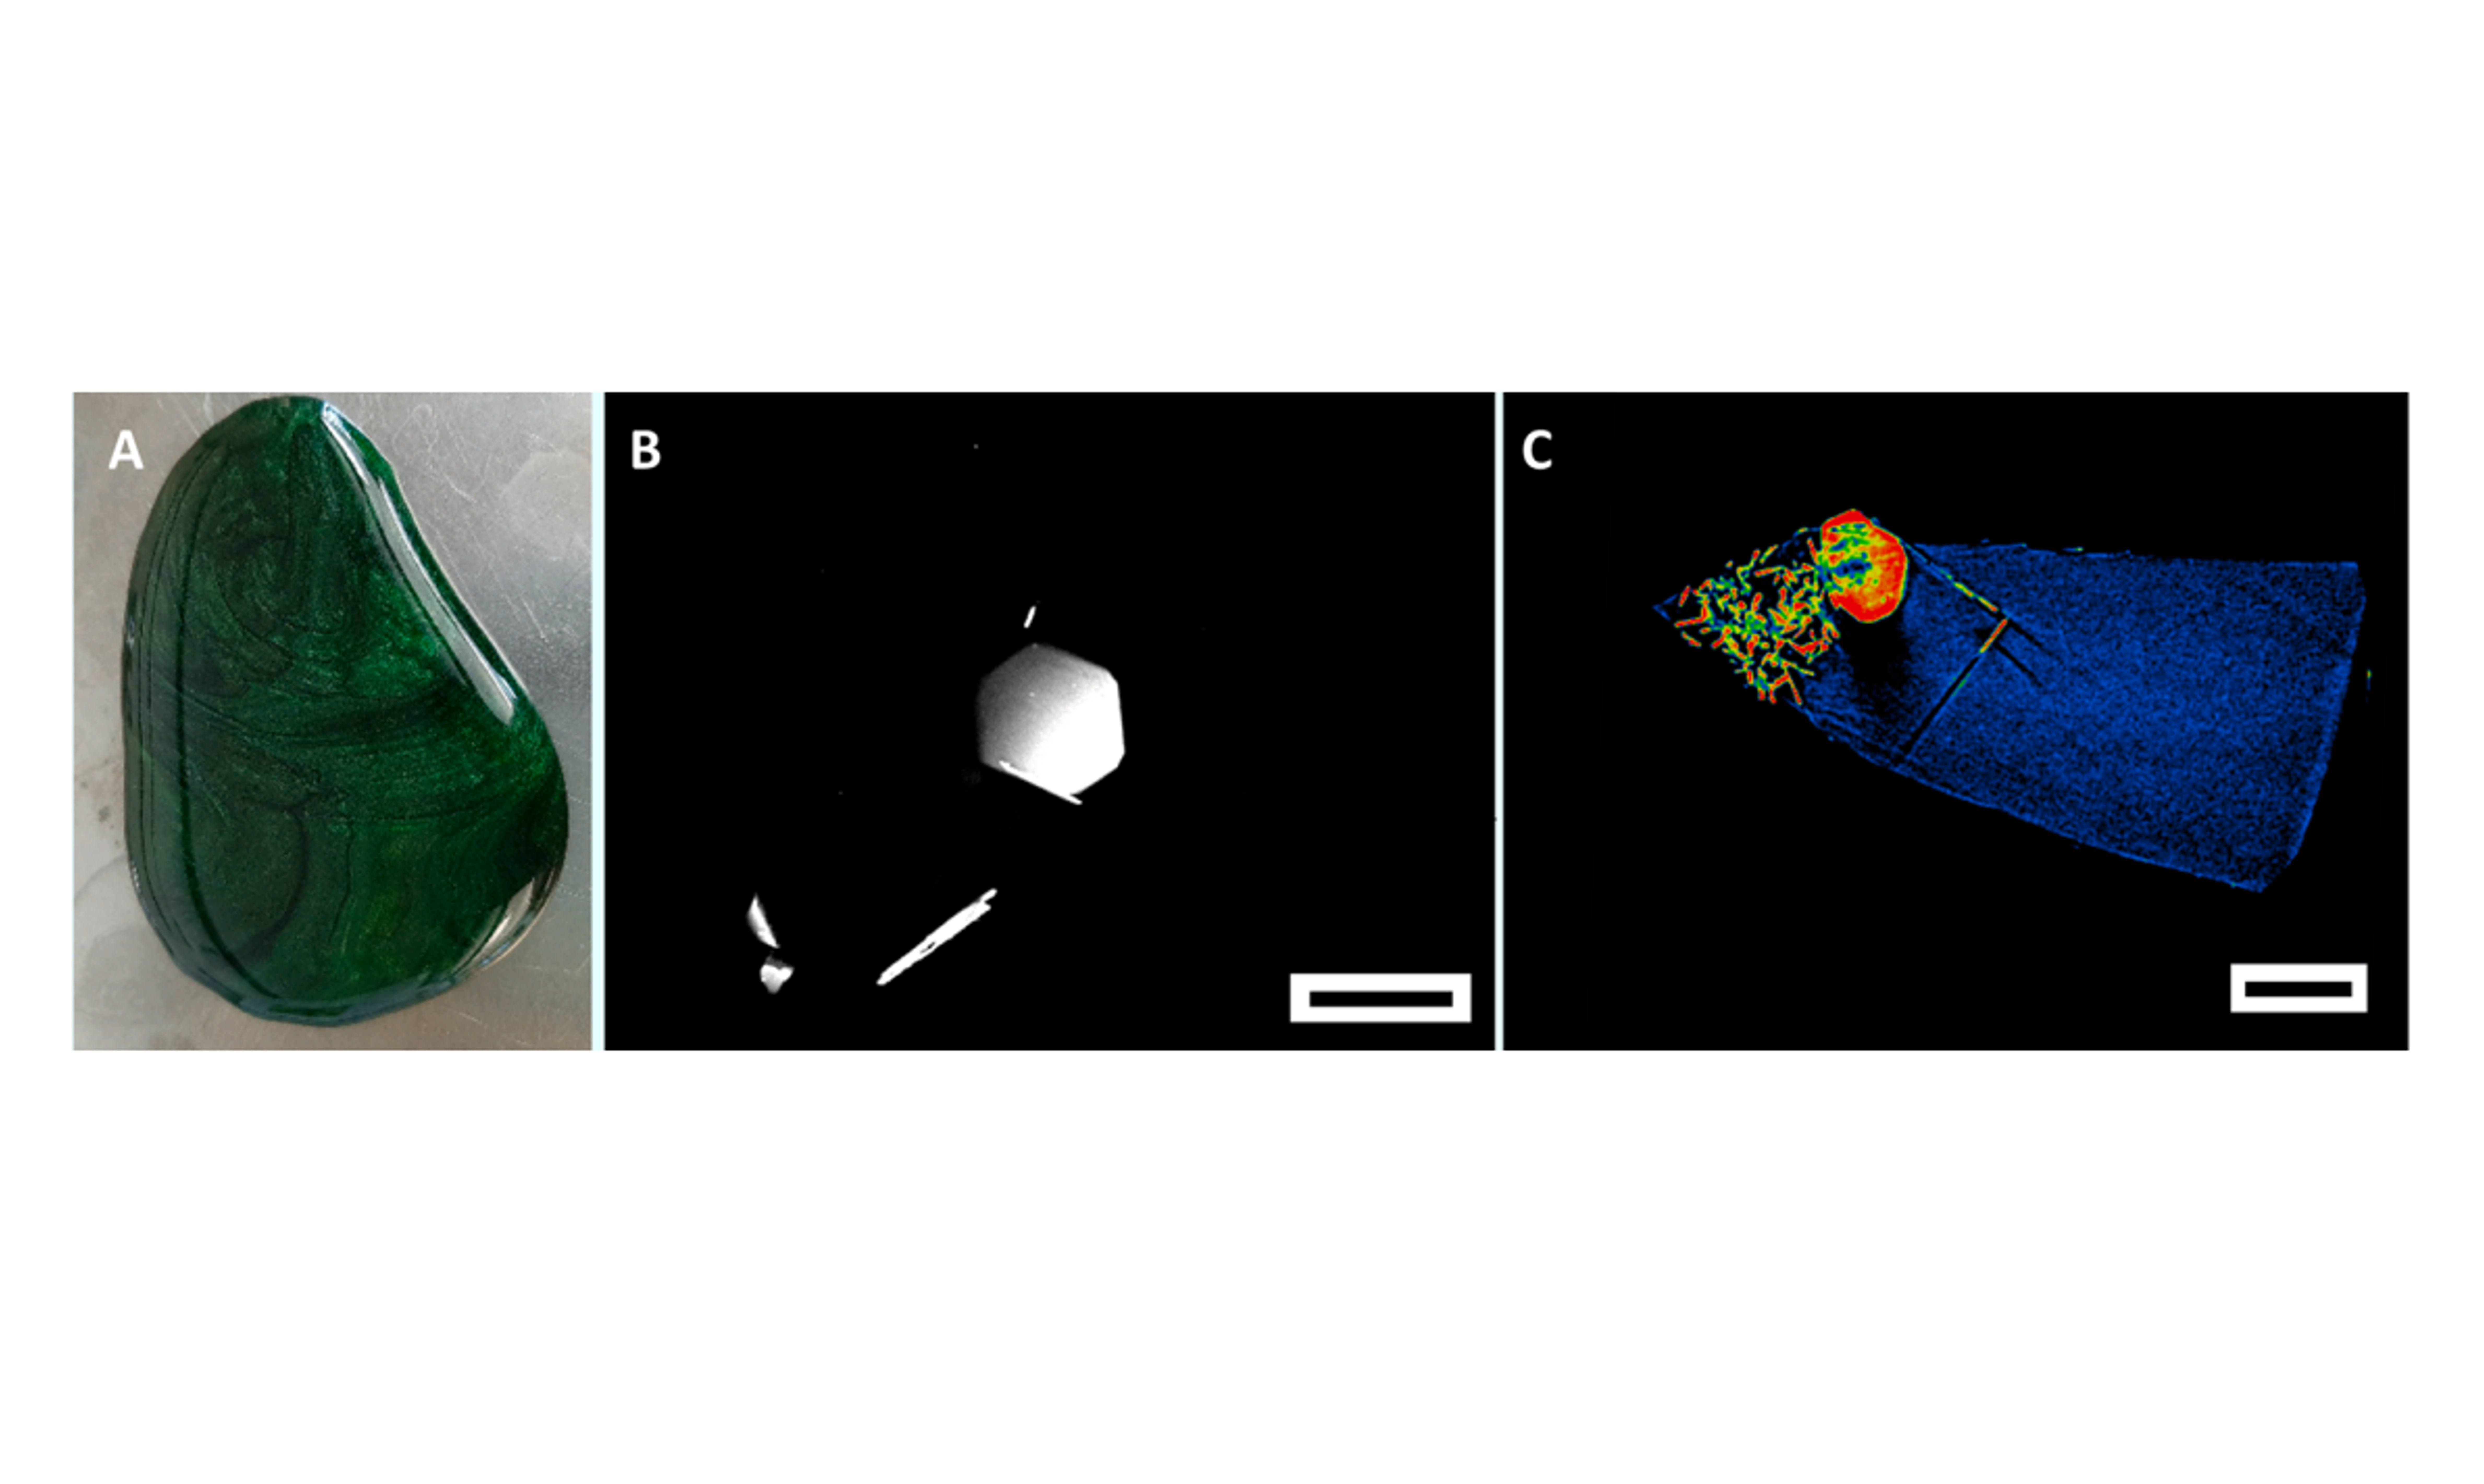
Eskolaite Crystals
Smith-Gray et al., J. Non-Cryst. Solids 597 (2022) 121924.
2. Nuclear Materials
Three-dimensional characterization of nanopores, phase distributions, internal defects, and material interfaces in tritiated ceramics, nuclear waste forms, and related nuclear materials.
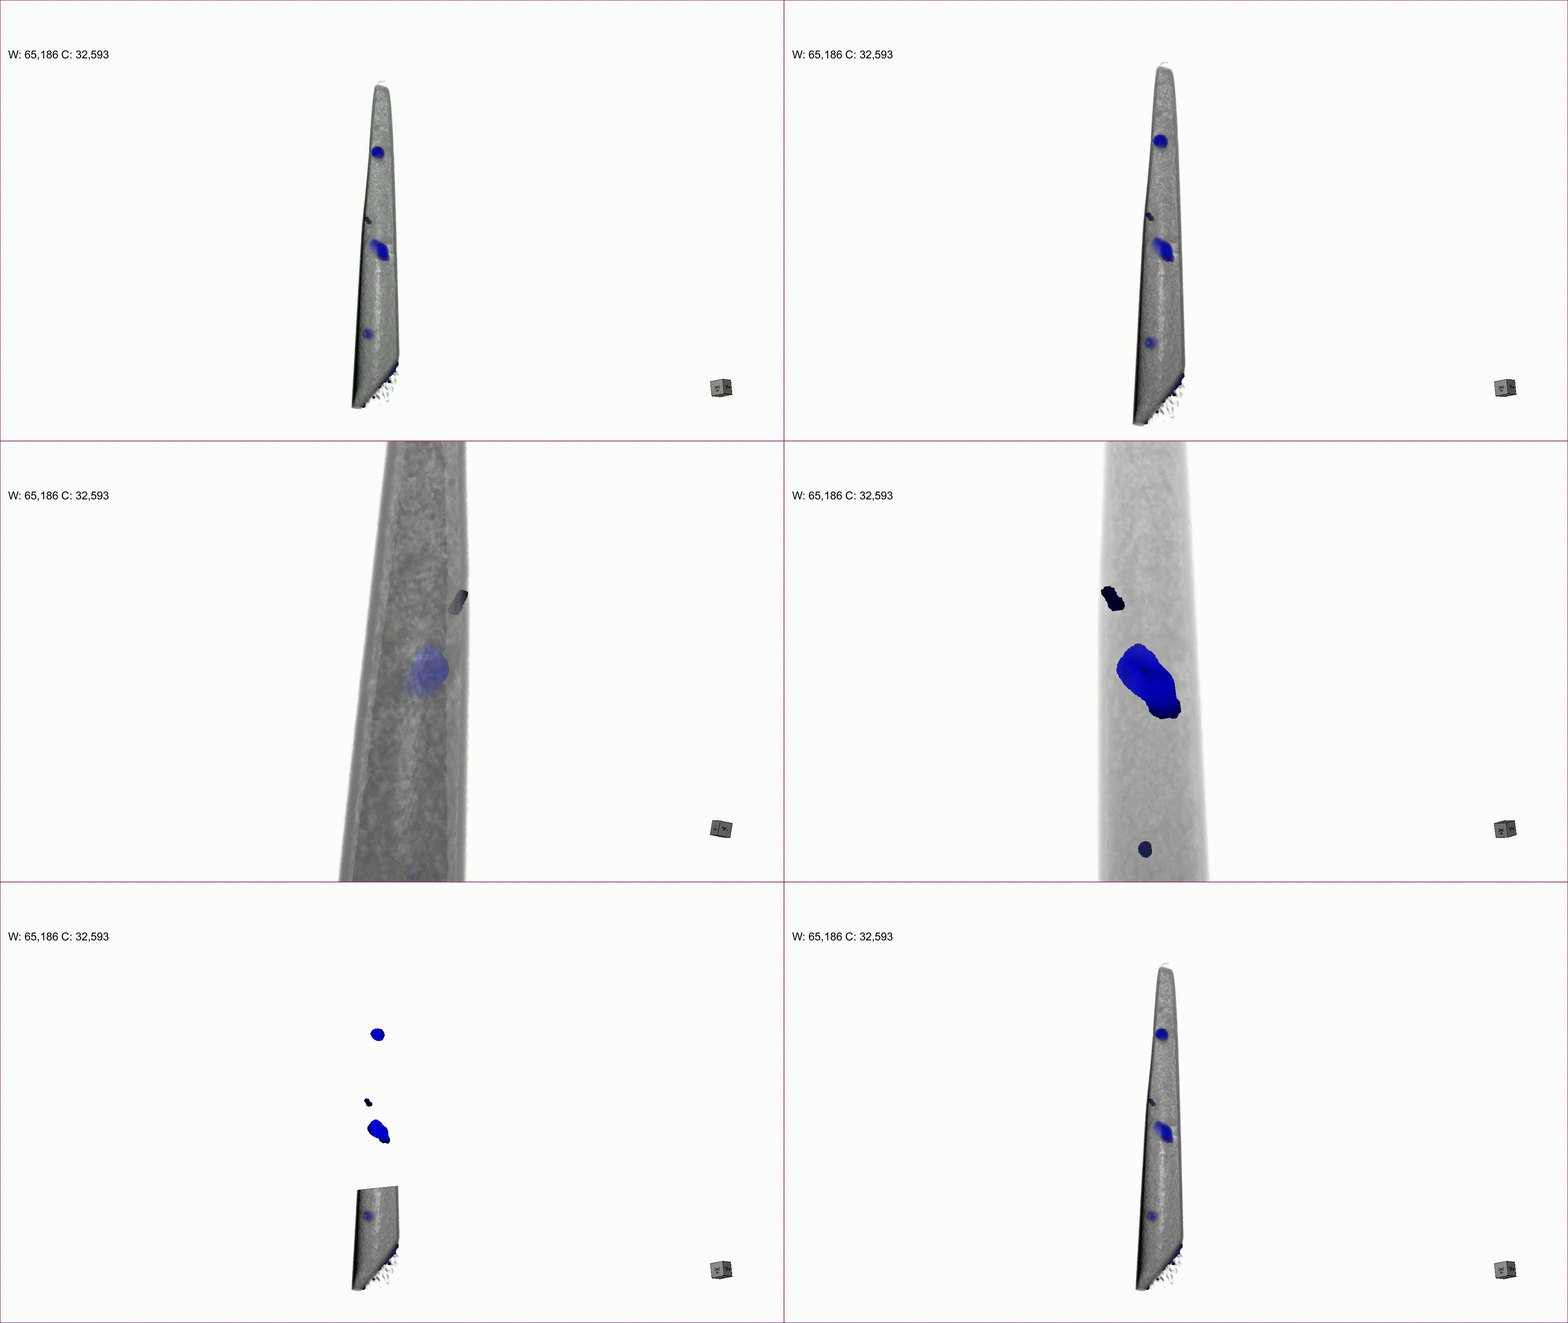
UO2
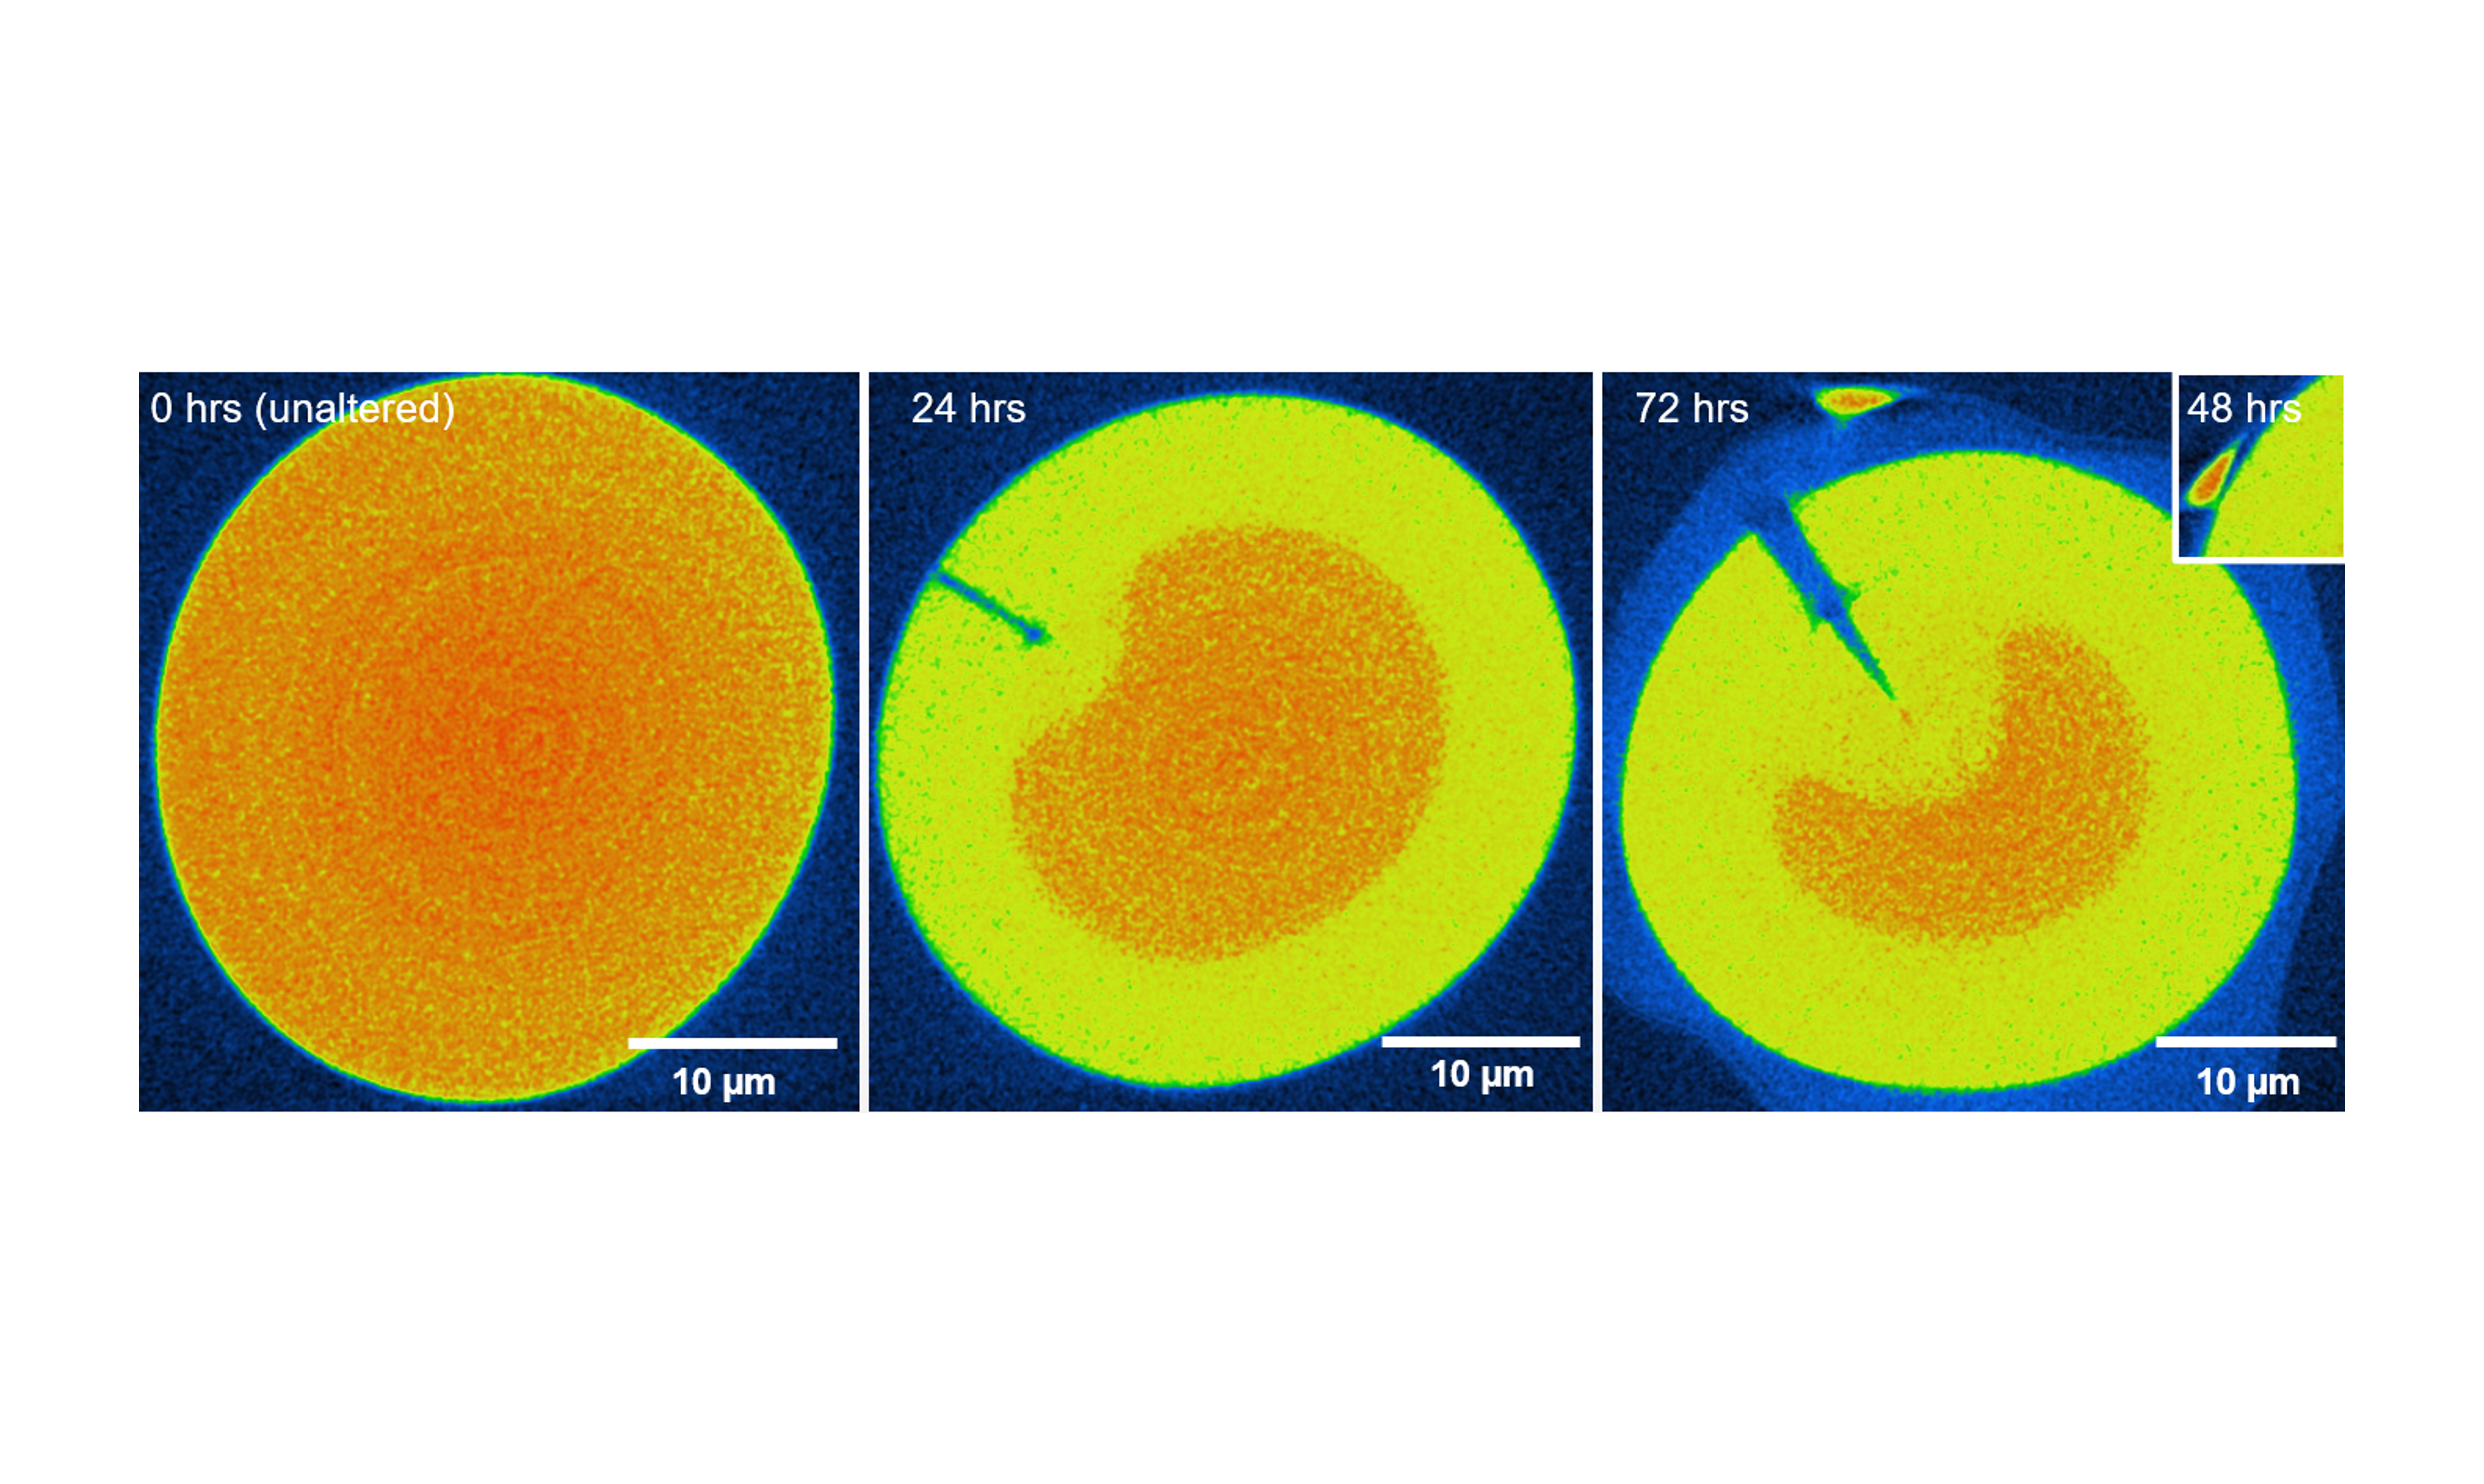
Aqueous Alteration of Nuclear Waste Glass
Weber et al., MRS Advances 9 (2024) 467–472.
3D Microstructure of Nuclear Glass–Refractory Interactions
Smith-Gray et al., J. Am. Ceram. Soc. (2022), jace.18706.
3. Batteries
Three-dimensional visualization of electrode particles, porosity, cracks, interfaces, and internal structural evolution in battery materials.
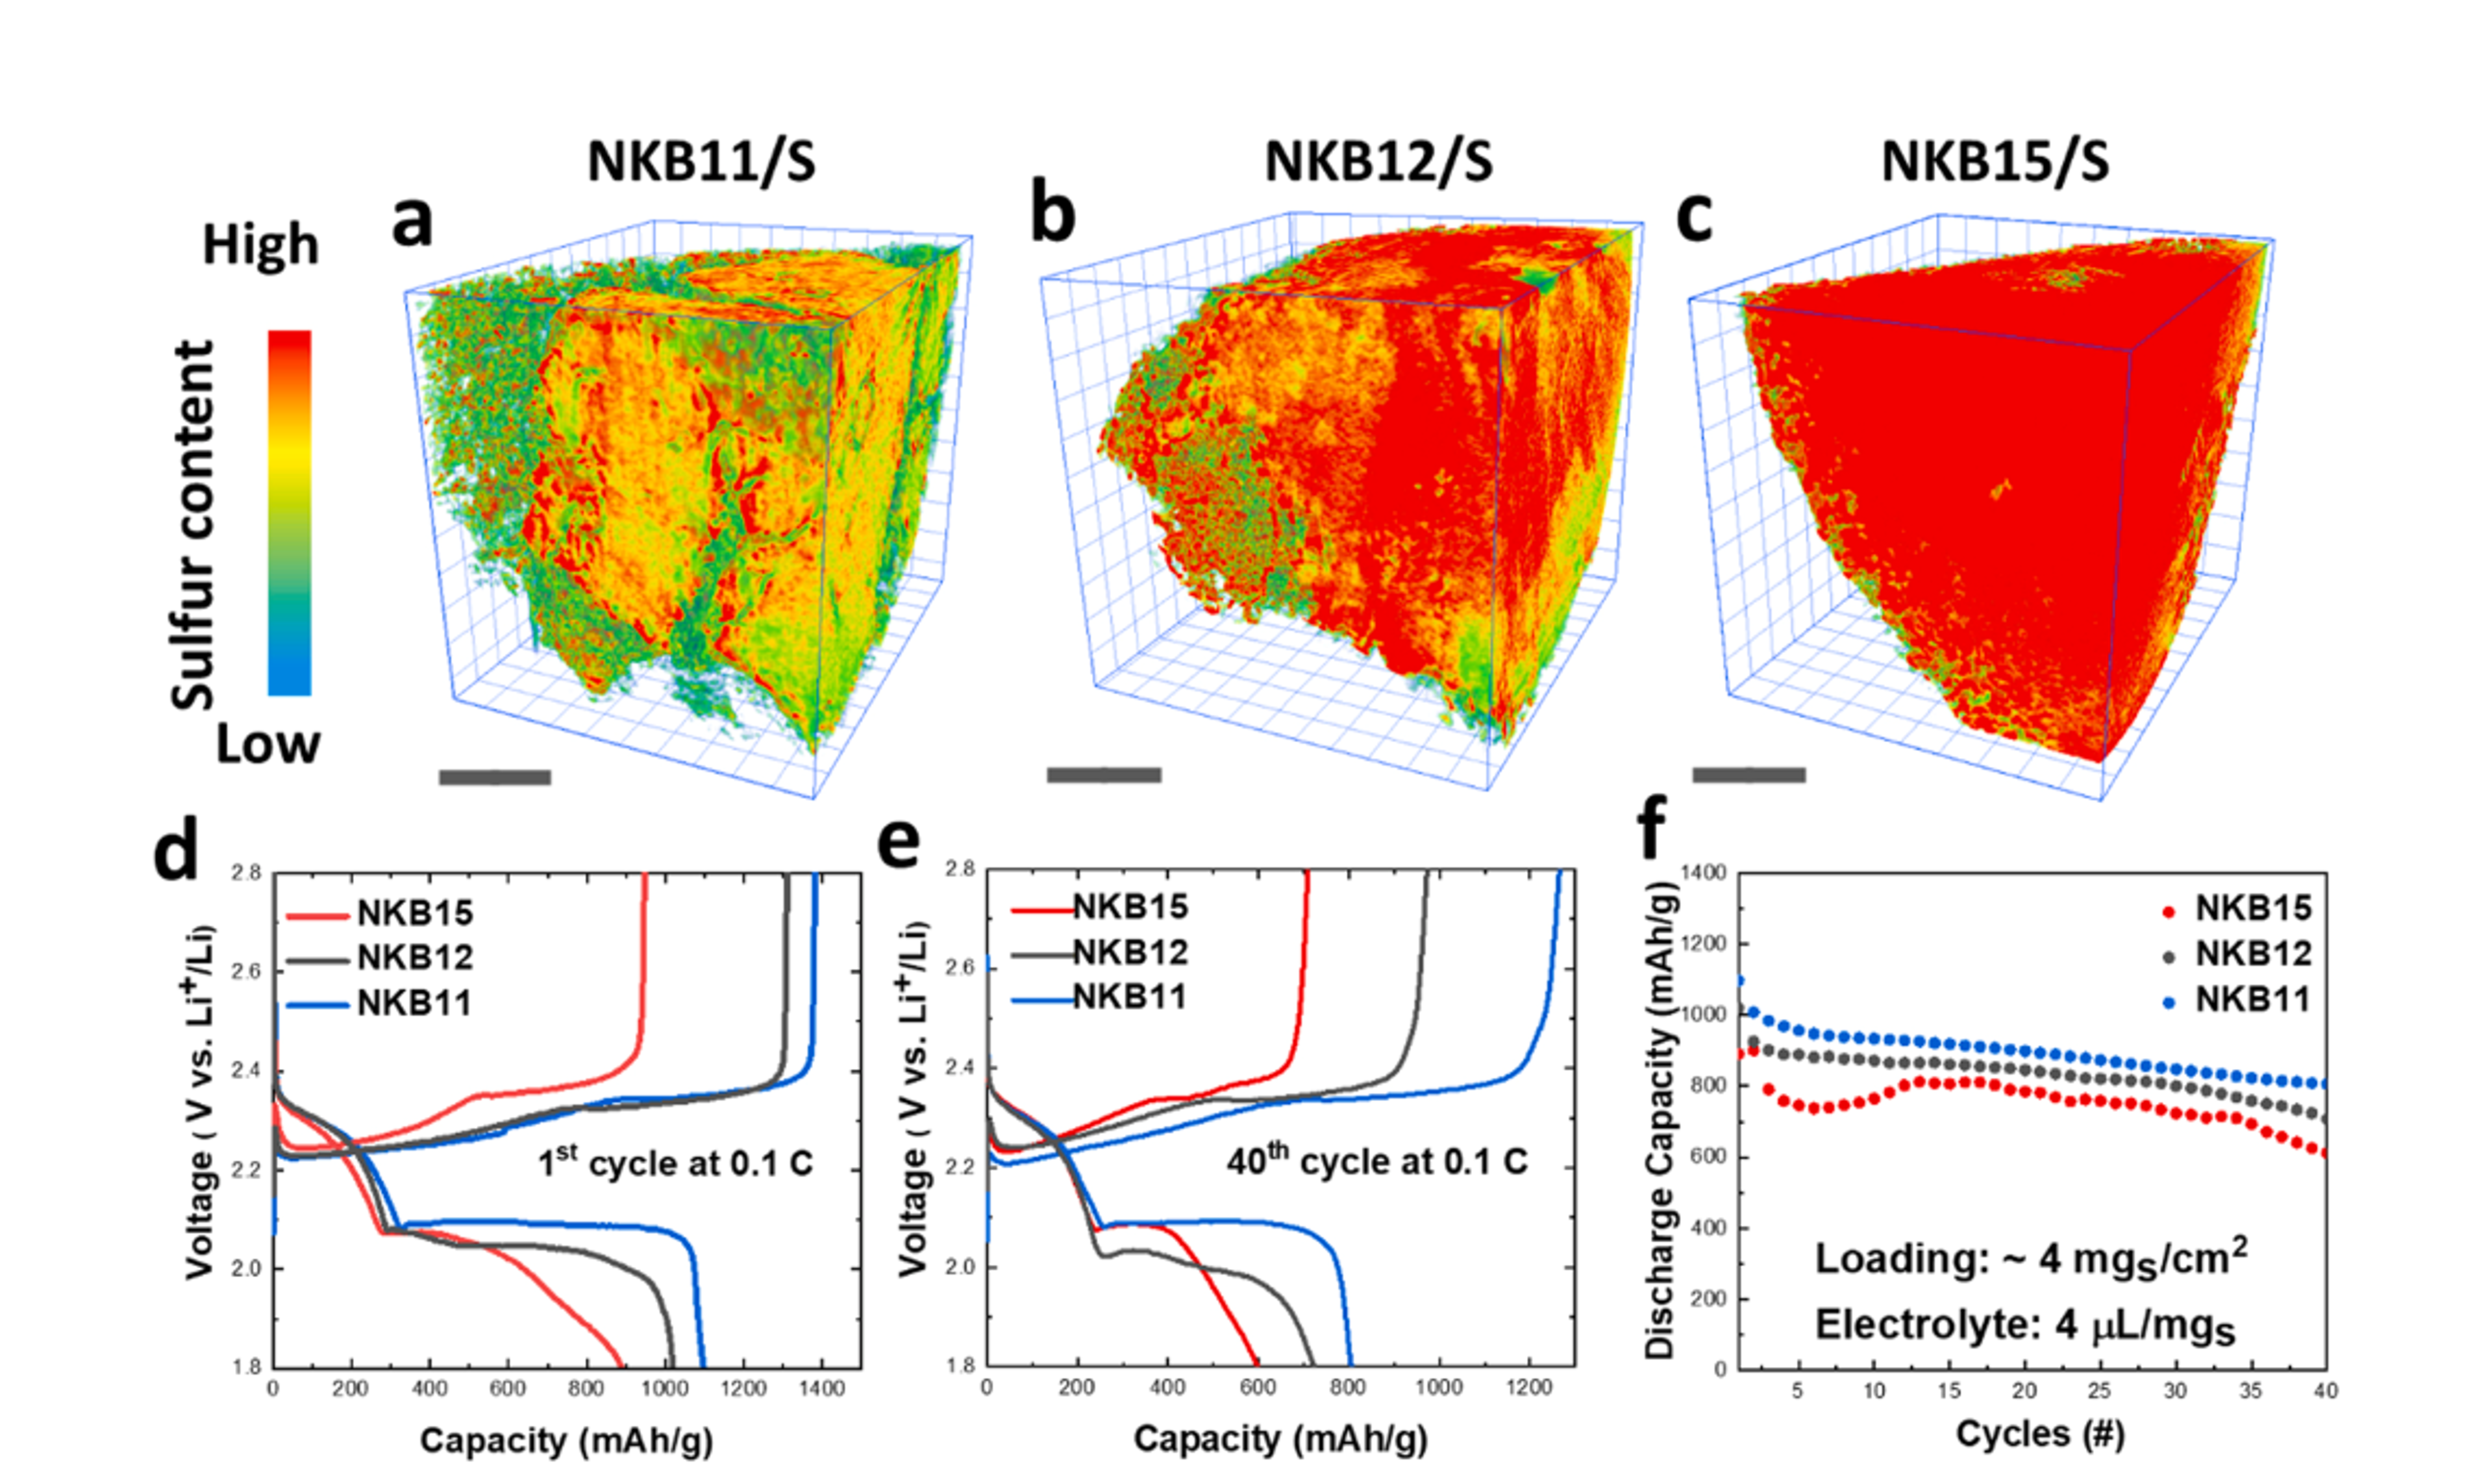
Sulfur Distribution in Li–S Cathode Particles
Discharge and charge curves of different NKB/S electrodes in the first cycle. (e) Discharge and charge curves of different NKB/S electrodes after 40 cycles. (f) Cyclingperformance of different NKB/S electrodes in 40 cycles
Feng et al., Nano Energy 103 (2022) 107794.
SeS₂ Battery Cathode
Dong et al., Nano Energy 69 (2020) 104434.
4. Archeological Materials
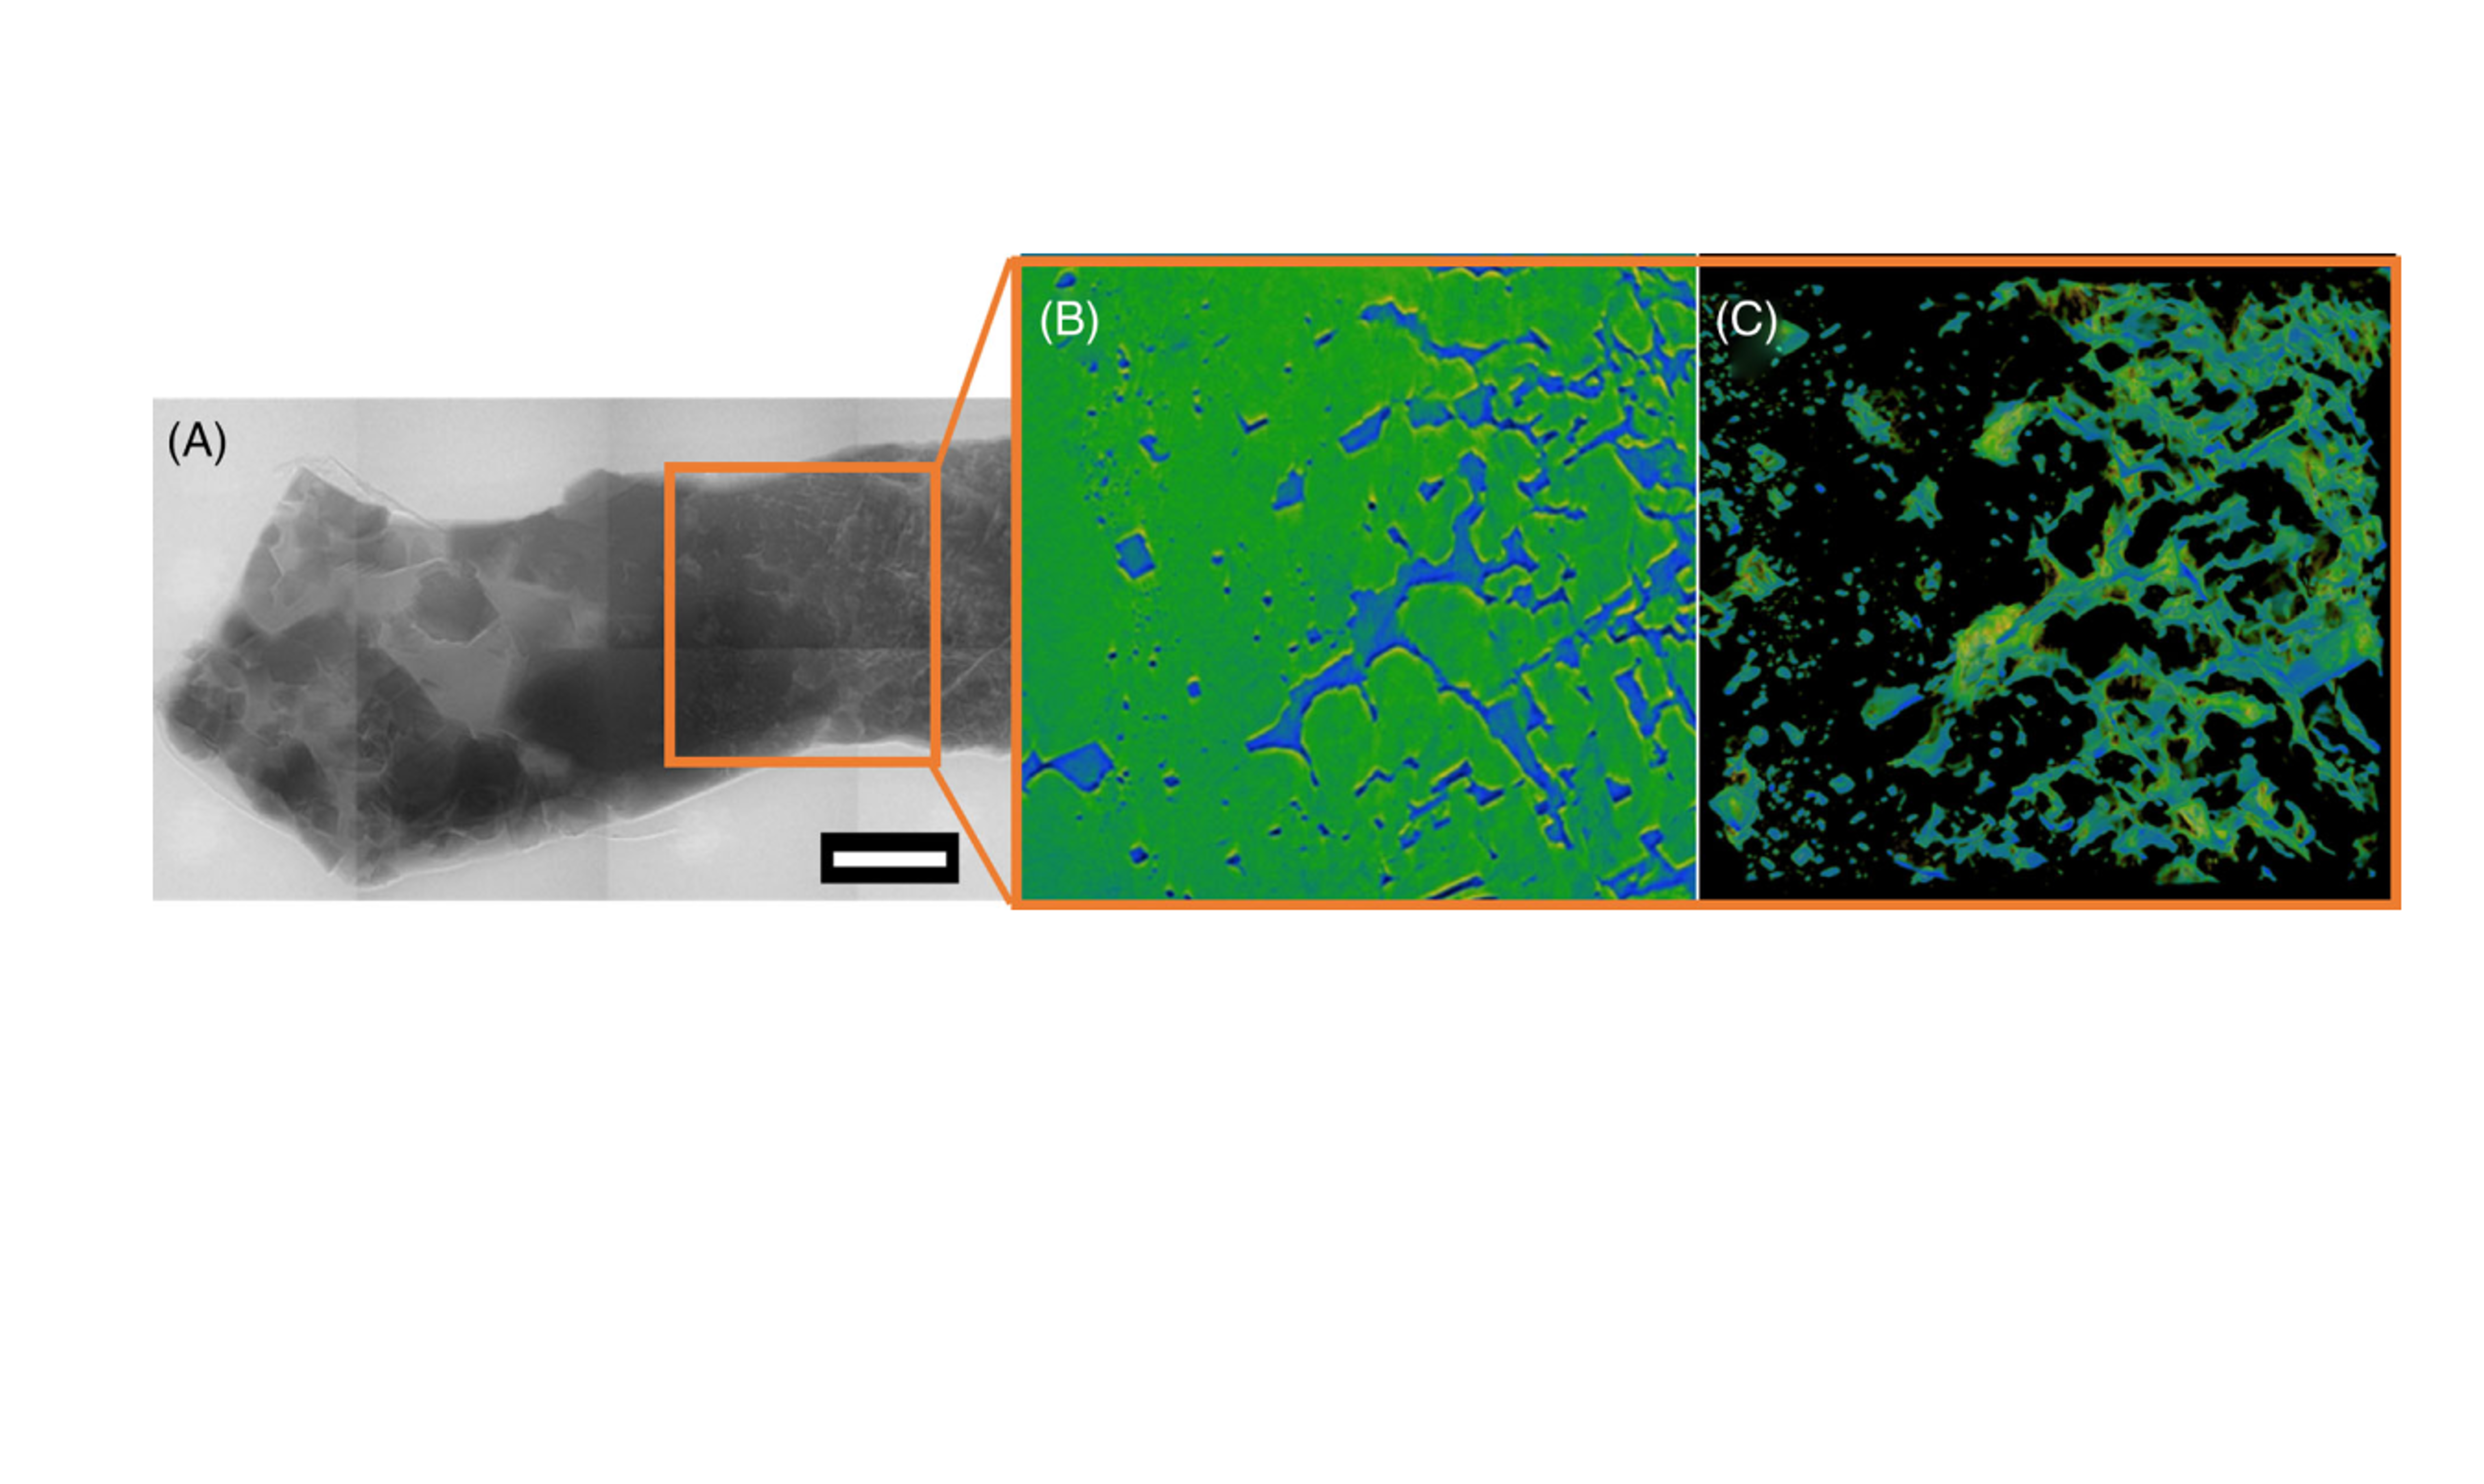
Archaeological Cartonnage Fragment
X-ray transmission image of uppermost surface of the mounted microsampleshown in (b). c, d X-ray tomograph virtual slices showing complex microstructure derived from full tomograph shown in (e) in a false color intensity scale (field of view65 μm width).
McCloy et al., npj Heritage Science 13 (2025) 202.
Contact
For research collaborations, sample feasibility, and nano-CT imaging inquiries, please contact:
Prof. John S. McCloy
john.mccloy@wsu.edu
John M. Bussey
john.bussey@wsu.edu